|
people
and work
population
families
occupations
schools
leisure
war
time
the
militia
customs
& legends
charity
|
occupations
See the
Directories page for lists of village tradespeople from 1854 to 1914. |
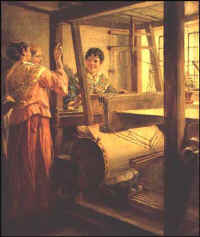
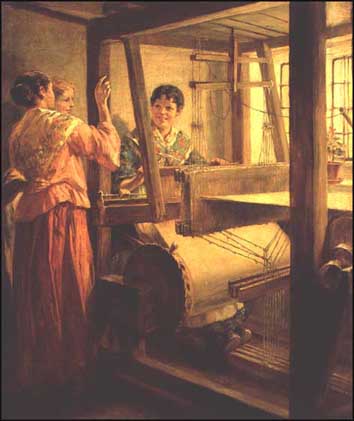
Handloom
weaving
AW
Bayes
|
1650
Between c1650 and
the early 1800s,
hand loom
weaving
was the most common occupation in the western area of Rockingham Forest.
In 1777, there were 23
weavers living in Cottingham (some are listed on the
1777 militia list), but competition from large industrial mills led to
the collapse of the hand loom weaving industry in the early years of the 19th
century.
This caused a great deal of poverty
and hardship for local people, especially in Corby where, at one time, around
89% of the working population was engaged in weaving and related activities. In
Kettering, with over a third of the population on poor relief, the situation
became so desperate that the town declared itself bankrupt!
By 1841, the industry had all but
disappeared in the area.
|
|
1800
In 1800, the lowest
weekly wage for regular employment in the area was two shillings a week (around
£4.90 in today's money) and the highest nine shillings and sixpence (around
£22).
|
|
1841
In 1841, the main occupation was farming
and agriculture, with the second most common occupation being domestic
service.
There were ten 15 year
olds working - six as servants, one apprentice and two agricultural
labourers. There was also one 12 year old working as a servant: Comfort
Tansley worked as a live-in servant for John Claypole, a publican on High
Street (possibly the Three Horseshoes). |
|
|
|
Click
on the hyperlinks above for breakdowns of the Occupation categories
1901
|
|
Click
on the hyperlinks above for breakdowns of the Occupation categories
|
|
In 1901, the main
source of income for local villagers was still farming and agriculture, with more than half
of the men in the village working on the land.
By this time, other common occupations for
village men were the local ironstone pits, brick making and gardening. The single women who went
out to work were employed mainly as tailoresses and machinists at
the local
clothing factory, or as domestic servants. Interestingly
though, not one of the married women in Cottingham went out to work. How times
change!
The
census also reveals 14 children aged between 13 and 15 going out to work. All
aged 13, John Cook was employed as a page boy at The Rectory, Annie Jarvis as a
tailoress at the clothing factory and William Claypole worked on his dad's farm.
14 year old Fred Pauler worked as a clerk at the clothing factory.
There
were 12 employers living in the village - eight farmers, a builder, a
stone mason, a baker and a publican. 34
people were self employed, of which 17 worked from home. Occupations
included tailor/dressmaker, laundress,
shoe and boot maker, baker
and
carpenter/wheelwright
Click
on the hyperlinks above for breakdowns of the Occupation categories
|
|
2001
The
estimates given for
Cottingham are based on information from the 2001 Census (for Corby's
rural west ward covering Cottingham, Middleton and East Carlton) and the
2001 Electoral Roll for Cottingham village.
|
2001
Occupations
|
Rural West ward |
% of adult population (16+) |
Estimate for Cottingham |
|
Employed |
814 |
65.8% |
491 |
|
Unemployed |
24 |
1.9% |
14 |
|
Economically active full-time students |
28 |
2.3% |
17 |
|
Economically inactive students |
38 |
3.1% |
23 |
|
Other economically inactive |
18 |
1.2% |
9 |
|
Looking after home/family |
58 |
4.7% |
35 |
|
Permanently sick or disabled |
40 |
3.2% |
24 |
|
Retired |
220 |
17.8% |
133 |
To compare these statistics
with national averages, visit the
national statistics 2001 Census website
Back to top of
page
|